Functions | |
| std::vector< AMSTrdMCTrack::Track > | GenerateTRDEvent (const TH1F *hFittedTRDtrksinMC, const bool &debugMode=false, const double &SIGMA_TRACK_CLUSTERS=1) |
| std::vector< int > | EstimateLayerLadderTube (double x, double y, double z, const bool debugMode=false) |
| double | GetRandomSampledEdep (const TH1F *hTRDEkinMaxZPrMC, const TH2F *h2D_TRDEkinMaxZPrMC_Edep, const bool debugMode=false) |
| double | generateNearEdge (double min, double max, TRandom3 &r3) |
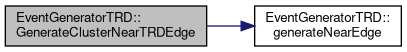
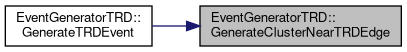
| AMSTrdMCTrack::Cluster | GenerateClusterNearTRDEdge (TRandom3 &r3) |
| AMSTrdMCTrack::Cluster | GenerateClusterAtMinDistance (const AMSTrdMCTrack::Cluster &P0, TRandom3 &r3) |
| AMSTrdMCTrack::Cluster | GenerateClusterOppositeP0 (const AMSTrdMCTrack::Cluster &P0, TRandom3 &r3) |
| std::vector< AMSTrdMCTrack::TRDTrack > | GenerateTRDEvent (const TH1F *hTRDEkinMaxZPrMC, const TH2F *h2D_TRDEkinMaxZPrMC_Edep, const TH2F *h2D_TRDMap_XZ, const TH2F *h2D_TRDMap_YZ, const TH2F *h2D_TRDMap_XY, const int nFakeTracksPerEvent=1, const bool debugMode=false, TH1D *hQA_nAttemptsPerFakeEvent=NULL, TH2D *hQA_FakeAngleVSLength=NULL, double SIGMA_TRACK_CLUSTERS=0.001) |
| TH2F * | GetModuleHistogramFakeTracks (const std::vector< AMSTrdMCTrack::TRDTrack > &fake_tracks, const bool debugMode=false, TH2F *hTRDEventMap_XZ=NULL, TH2F *hTRDEventMap_YZ=NULL) |
| Function to process fake tracks and return a filled histogram. More... | |
Function Documentation
◆ EstimateLayerLadderTube()
| std::vector<int> EventGeneratorTRD::EstimateLayerLadderTube | ( | double | x, |
| double | y, | ||
| double | z, | ||
| const bool | debugMode = false |
||
| ) |
x, y, and z are TRD hit/cluster coordinates in cm in the AMS coordinate system
static define TRD maps
Fixed maps
Fixed maps
Find Layer from both histograms
Check for consistency in layer determination
Initialize variables for ladder and tube
Determine Ladder and Edge values based on the layer
Determine the Tube by calculating which partition the coordinate lies in
◆ GenerateClusterAtMinDistance()
| AMSTrdMCTrack::Cluster EventGeneratorTRD::GenerateClusterAtMinDistance | ( | const AMSTrdMCTrack::Cluster & | P0, |
| TRandom3 & | r3 | ||
| ) |
Function to generate a second cluster at a minimum distance from the first cluster.
- Generate the First Point: This is done using the GenerateClusterNearTRDEdge function.
- Calculate the Direction from the First Point to the Fixed Point: This gives us the general direction in which to place the second point.
- Generate the Second Point: Place the second point in the general direction towards the fixed point while ensuring it is at least the minimum distance away from the first point.
Detailed Steps
- Calculate the Vector: Compute the vector from the first point to the fixed point (0, 0, 120).
- Normalize the Vector: Normalize this vector to get the direction.
- Generate a Random Displacement Along This Vector: Ensure the displacement is at least the minimum distance.
- Adjust the Coordinates: Make sure the second point is within the bounds and respects the constraints.
We want the second point to be in the general direction of this point which is near the center of the TRD.
Calculate the direction vector from P0 to the fixed point
Normalize the direction vector
Generate a random displacement along the direction vector
Initialize N and calculate the new point
Calculate the updated distance between P0 and Pn
◆ GenerateClusterNearTRDEdge()
| AMSTrdMCTrack::Cluster EventGeneratorTRD::GenerateClusterNearTRDEdge | ( | TRandom3 & | r3 | ) |
function to directly generate points close to the edges
Y resolution, X is free
X resolution, Y is free
X resolution, Y is free
Y resolution, X is free
◆ GenerateClusterOppositeP0()
| AMSTrdMCTrack::Cluster EventGeneratorTRD::GenerateClusterOppositeP0 | ( | const AMSTrdMCTrack::Cluster & | P0, |
| TRandom3 & | r3 | ||
| ) |
z = 110 cm is near the middle of the TRD along the Z axis.
◆ generateNearEdge()
| double EventGeneratorTRD::generateNearEdge | ( | double | min, |
| double | max, | ||
| TRandom3 & | r3 | ||
| ) |
Helper function to directly generate points close to the edges
define 2% of the range
50% probability of generating the point near the minimum edge
50% probability of generating the point near the maximum edge

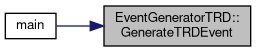
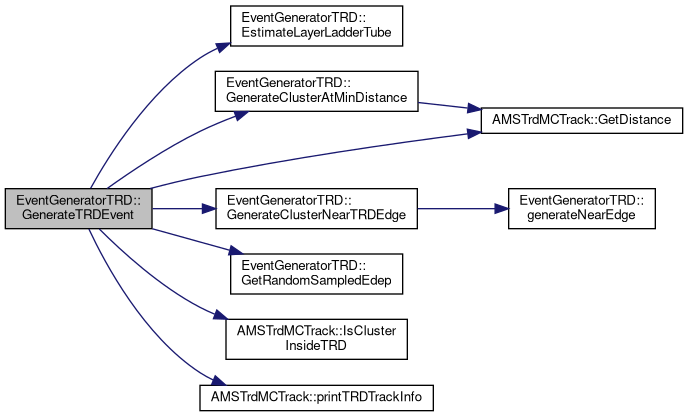
◆ GenerateTRDEvent() [1/2]
| std::vector<AMSTrdMCTrack::Track> EventGeneratorTRD::GenerateTRDEvent | ( | const TH1F * | hFittedTRDtrksinMC, |
| const bool & | debugMode = false, |
||
| const double & | SIGMA_TRACK_CLUSTERS = 1 |
||
| ) |
GenerateTRDEvent first initializes a single P0 point, which is used for all the N sim 3D tracks, forming a star/vertex. Each sim 3D track will then have this P0 and a corresponding unique randomly-generated Pn. For each 3D sim track (defined by P0 and Pn), we generate M clusters. We use the differences in the x, y, and z coordinates between P0 and Pn (divided by M) to create uniformly-spaced clusters along the 3D line. Finally, we save these clusters into the clusters vector of the corresponding AMSTrdMCTrack::Track.
Each 3D sim track is also assigned fake trkID and g3PID (with at least one proton track in per event). The entire event is retuned as a vector of AMSTrdMCTrack::Track's
Initialize the random number generator
Generate initial random 3D point inside the TRD
Decide on the number of tracks (between 0 and 50).
To match the actual distribution of N as seen in MC.
We want to simulate background events, not single track clean events.
Preallocate a vector to hold our tracks.
For each of the N points:
- generate a point. 2. construct realistic 3D clusters for this track. 3. Save the track.
Assign a unique ID starting from 1.
For the first track, set g3PID to 14, for others randomize it between -50 and 50.
Generate a unique Pn for this track.
Decide on the number of clusters for each track
Generates integer between 2 and 100
Calculate delta values for x, y, and z to generate M uniformly-spaced clusters.
Loop over M to save clusters
Print event info
At this point, track contains all the smeared cluster points. You can now proceed to process or store the track as required.
◆ GenerateTRDEvent() [2/2]
| std::vector<AMSTrdMCTrack::TRDTrack> EventGeneratorTRD::GenerateTRDEvent | ( | const TH1F * | hTRDEkinMaxZPrMC, |
| const TH2F * | h2D_TRDEkinMaxZPrMC_Edep, | ||
| const TH2F * | h2D_TRDMap_XZ, | ||
| const TH2F * | h2D_TRDMap_YZ, | ||
| const TH2F * | h2D_TRDMap_XY, | ||
| const int | nFakeTracksPerEvent = 1, |
||
| const bool | debugMode = false, |
||
| TH1D * | hQA_nAttemptsPerFakeEvent = NULL, |
||
| TH2D * | hQA_FakeAngleVSLength = NULL, |
||
| double | SIGMA_TRACK_CLUSTERS = 0.001 |
||
| ) |
Modified function for specific use in generating synthetic/fake TRD sidetracks
Initialize the random number generator
Preallocate a vector to hold our tracks.
Generate initial random 3D point inside the TRD
Generate a unique end point Pn for this track.
Check the angle with the Z-axis
Some debugging if needed
Skip this line if the conditions are not met
Decide on the number of clusters for each track
Generate an integer
Loop over M to save clusters
Check if the cluster is inside the TRD
Move to test the next cluster on the line
Move to test the next cluster on the line
Get Ladder, Layer, Hit
Move to test the next cluster on the line
Get Edep
Set cluster values
"x, y, z, Layer, Ladder, Tube, Edep"
Print event info
◆ GetModuleHistogramFakeTracks()
| TH2F* EventGeneratorTRD::GetModuleHistogramFakeTracks | ( | const std::vector< AMSTrdMCTrack::TRDTrack > & | fake_tracks, |
| const bool | debugMode = false, |
||
| TH2F * | hTRDEventMap_XZ = NULL, |
||
| TH2F * | hTRDEventMap_YZ = NULL |
||
| ) |
Function to process fake tracks and return a filled histogram.
Create the module histogram Note: Event maps are in coordiate space (XZ, YZ, XZ in cm x cm) and Module maps are in module space (Layer# x Ladder#)
◆ GetRandomSampledEdep()
| double EventGeneratorTRD::GetRandomSampledEdep | ( | const TH1F * | hTRDEkinMaxZPrMC, |
| const TH2F * | h2D_TRDEkinMaxZPrMC_Edep, | ||
| const bool | debugMode = false |
||
| ) |
Check if histograms are successfully opened
Sample from the hTRDEkinMaxZPrMC histogram to get a value of Ekin
Find the bin on the x-axis of the 2D histogram corresponding to the sampled Ekin
Get a projection of the Y-axis for the specific X bin (Ekin value)
Sample from the projected Y histogram to get a value of Edep
Clean up the temporary histogram to prevent memory leaks
Return the sampled Edep value